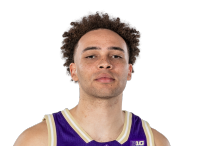
Ryan Beasley
Washington · G
 WA
#0 · Senior · 5'11", 180 lbs · San Ramon, CA
Transferred from San Francisco
2 games this season, from ESPN’s box scores
Ryan Beasley props, stats and game log
Watch Ryan Beasley free. Get an alert when his props are posted or his injury status changes.Sign up free
This game vs COLG · COLG 76, WASH 90 · Final
36MIN
8PTS
2-7FG
2-63PT
2-2FT
5REB
4AST
1TO
2STL
0BLK
0OREB
5DREB
2PF
From ESPN’s box score. Below: averages and every game this season and last.
Play time minutes a game
35Last 52 games
35Last 102 games
352026–272 games
Props vs UTU · Thu 9:00 PM ET
The books haven’t posted props for Ryan Beasley in this game yet. In college basketball they come from the pick’em apps, mostly for the bigger games, a day or so before.
Utah Tech against guards
Points Great matchupGuards get 7% more points than usual against UTU (34.8 a game), the 48th most of 375 (early season: leans on last season)
Rebounds Neutral matchupGuards get 3% fewer rebounds than usual against UTU (8.3 a game), the 151st least of 375 (early season: leans on last season)
Assists Neutral matchupGuards get 9% fewer assists than usual against UTU (6 a game), the 89th least of 375 (early season: leans on last season)
Threes Neutral matchupGuards get 3% more threes made than usual against UTU (4.5 a game), the 131st most of 375 (early season: leans on last season)
Averages a game played
| GP | MIN | PTS | REB | AST | 3PM | STL | BLK | TO | |
|---|---|---|---|---|---|---|---|---|---|
| 2026–27 | 2 | 35 | 12 | 7.5 | 5 | 3 | 1.5 | 0 | 1.5 |
Shooting made-tried a game
| GP | FG | 3PT | FT | |
|---|---|---|---|---|
| 2026–27 | 2 | 4-944.4% | 3-7.540% | 1-1100% |
From ESPN’s box scores; the percentages are of every shot in the stretch.
Where he ranks 2026–27
12.0PTS
7.5REB
5.0AST
44.4FG%
On Washington · 2 of 3 games played
- 1st in rebounds7.5 a game
- 1st in assists5 a game
- 2nd in 3s made3 a game
- 3rd in points12 a game
14% of Washington’s points in his games
15% of Washington’s shots in his games
Ranks in Division I, from ESPN; shown for the top 500. His team’s numbers from ESPN’s box scores, players with 40% of its games.
Career a game, by season
| Season | School | GP | MIN | PTS | REB | AST | 3PM | FG% | 3P% | FT% |
|---|---|---|---|---|---|---|---|---|---|---|
| 2026–27 | Washington | 2 | 34.5 | 12.0 | 7.5 | 5.0 | 3.0 | 44.4 | 40.0 | 100.0 |
| 2025–26 | San Francisco | 31 | 33.3 | 13.6 | 3.4 | 4.0 | 1.6 | 40.7 | 32.7 | 82.7 |
| 2024–25 | San Francisco | 29 | 25.2 | 9.0 | 2.4 | 2.4 | 1.0 | 44.3 | 29.9 | 84.1 |
| 2023–24 | San Francisco | 30 | 22.3 | 7.8 | 2.4 | 1.6 | 1.1 | 39.5 | 35.4 | 85.9 |
| Career | 92 | 27.2 | 10.3 | 2.8 | 2.8 | 1.3 | 41.5 | 33.0 | 84.0 |
From ESPN; a college season counts the games ESPN has box scores for.
Game log 2 played
News stories and highlights
Loading the latest on Ryan Beasley…
Player stats from ESPN’s box scores; lines and prices from the books, through The Odds API. Hit rates count games played. Picks are counted across pools, My bets and Tail on The Coalition without names. Research, not betting advice. 21+.