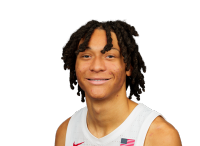
Tyrin Jones
UNLV · F
 UN
#6 · Sophomore · 6'10", 200 lbs · Las Vegas, NV
4 games this season, from ESPN’s box scores
Tyrin Jones props, stats and game log
Watch Tyrin Jones free. Get an alert when his props are posted or his injury status changes.Sign up free
Play time minutes a game
32.3Last 54 games
32.3Last 104 games
32.32026–274 games
Props Live @ AUB · H1 12:44
Games
Points 13.5 Great matchup
over in 3 of 4 · avg 14.8
Low 12 · middle 15 · high 17
O 13.5 -115
U 13.5 -111
Edge +25%
Forwards get 21% more points than usual against AUB (5.5 a game), the 16th most of 369 (early season: leans on last season)
Rebounds 6.5 Tough matchup
over in 1 of 4 · avg 5.5
Low 3 · middle 5.5 · high 8
O 6.5 +116
U 6.5 -152
Edge -18%
Forwards get 21% fewer rebounds than usual against AUB (0.8 a game), the 6th least of 369 (early season: leans on last season)
Pts+Reb+Ast 22.5 Great matchup
over in 2 of 4 · avg 21.3
Low 17 · middle 22 · high 24
O/U 22.5PrizePicks +1
Forwards get 6% more points, rebounds and assists than usual against AUB (6.8 a game), the 60th most of 369 (early season: leans on last season)
Pts+Reb 20.5 Good matchup
over in 2 of 4 · avg 20.3
Low 17 · middle 21 · high 22
O 20.5 -102
U 20.5 -125
Edge +2%
Forwards get 5% more points and rebounds than usual against AUB (6.3 a game), the 64th most of 369 (early season: leans on last season)
Pts+Ast 15.5 Great matchup
over in 2 of 4 · avg 15.8
Low 13 · middle 16 · high 18
O/U 15.5Underdog
Forwards get 20% more points and assists than usual against AUB (6 a game), the 13th most of 369 (early season: leans on last season)
Lines checked 1 hr ago. A typical book’s price at the line most books post; your book’s may differ.
Averages a game played
| GP | MIN | PTS | REB | AST | 3PM | STL | BLK | TO | |
|---|---|---|---|---|---|---|---|---|---|
| 2026–27 | 4 | 32.3 | 14.8 | 5.5 | 1 | 0.5 | 1.5 | 2.5 | 1.3 |
Season highs 2026–27 · 4 games
17PTS11/7 vs SAM
8REB11/3 vs NAU
2AST11/13 vs STAN
13PM11/13 vs STAN
2STL11/17 @ KU
6BLK11/7 vs SAM
- 10+ points in all 4 games this season
His games this season, from ESPN’s box scores. A streak runs back from his latest game; a game he sat out doesn’t end it.
Shooting made-tried a game
| GP | FG | 3PT | FT | |
|---|---|---|---|---|
| 2026–27 | 4 | 4-8.845.7% | 0.5-0.866.7% | 6.3-9.367.6% |
From ESPN’s box scores; the percentages are of every shot in the stretch.
Splits 2026–27, a game played
| GP | MIN | PTS | REB | AST | 3PM | STL | BLK | TO | |
|---|---|---|---|---|---|---|---|---|---|
| Home | 3 | 33.3 | 15 | 6.3 | 1.3 | 0.7 | 1.3 | 3.3 | 1 |
| Wins | 3 | 33.3 | 15 | 6.3 | 1.3 | 0.7 | 1.3 | 3.3 | 1 |
| Favored | 2 | 34 | 14.5 | 6.5 | 1 | 0.5 | 2 | 4 | 1 |
| Underdog | 2 | 30.5 | 15 | 4.5 | 1 | 0.5 | 1 | 1 | 1.5 |
| 2+ days’ rest | 3 | 31.7 | 15.7 | 4.7 | 1 | 0.3 | 1.3 | 2.7 | 1.3 |
Favored and underdog go by his team’s spread at the game. A split shows with 2 games or more.
Where he ranks 2026–27
14.8PTST-333rd
5.5REBT-485th
1.0AST
45.7FG%
On UNLV · 4 of 4 games played
- 1st in rebounds5.5 a game
- 3rd in points14.8 a game
- 5th in assists1 a game
- 5th in 3s made0.5 a game
18% of UNLV’s points in his games
15% of UNLV’s shots in his games
Ranks in Division I, from ESPN; shown for the top 500. His team’s numbers from ESPN’s box scores, players with 40% of its games.
Career a game, by season
| Season | School | GP | MIN | PTS | REB | AST | 3PM | FG% | 3P% | FT% |
|---|---|---|---|---|---|---|---|---|---|---|
| 2026–27 | UNLV | 4 | 32.3 | 14.8 | 5.5 | 1.0 | 0.5 | 45.7 | 66.7 | 67.6 |
| 2025–26 | UNLV | 32 | 27.0 | 11.9 | 5.0 | 1.4 | 0.1 | 59.4 | 25.0 | 48.8 |
| Career | 36 | 27.6 | 12.2 | 5.1 | 1.4 | 0.1 | 57.7 | 36.4 | 52.2 |
From ESPN; a college season counts the games ESPN has box scores for.
Game log 4 played
News stories and highlights
Loading the latest on Tyrin Jones…
Player stats from ESPN’s box scores; lines and prices from the books, through The Odds API. Hit rates count games played. Picks are counted across pools, My bets and Tail on The Coalition without names. Research, not betting advice. 21+.