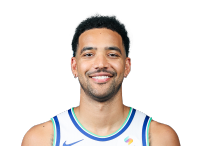
Trey Lyles
 MT
#41 · 11th season · 6'9", 234 lbs · Age 31 · Indianapolis, IN · Kentucky · Drafted 2015: Rd 1, Pk 12 (UTAH)
Before: Sacramento Kings, Detroit Pistons, San Antonio Spurs
15 games this season, from ESPN’s box scores
Trey Lyles Over 5.5 reb+ast vs NY: hit in 3 of last 10 games
Trey Lyles went over 5.5 reb+ast in 3 of his last 10 games, averaging 5.2 (high 15, low 0). Nov 19 vs NY, live: 5 so far.
Watch Trey Lyles free. Get an alert when his props are posted or his injury status changes.Sign up free
This game vs NY · NY 71, MIN 59 · Q3 8:36
The pickOver 5.5 reb+ast5 so far, 1 to goSave
5Reb+Astline 5.5
9MINavg 19.1
5PTS
4REB
1AST
13PM
0STL
0BLK
1TO
From ESPN’s box score, updated through the game. Below: props, averages and every game this season and last.
Play time minutes a game
21Last 55 games
20.9Last 1010 games
19.12026–2715 games
Props Live vs NY · Q3 8:36
Games
WithoutNo oneA. Edwards outD. DiVincenzo outJaylen Clark outRudy GobertJ. KumingaT. Shannon Jr.E. FreemanZyon Pullin
Anthony Edwards is out tonight. Each prop shows the games Anthony Edwards missed (11) next to the games both played.
Points 5.5 Tough matchup
over in 6 of 10 · avg 7.1
Low 2 · middle 7 · high 12
O 5.5 -130
U 5.5 +100
best O -115 BetMGM Edge +4%
Without A. Edwards7 of 11 · avg 7.1Both played1 of 4 · avg 4
Forwards get 14% fewer points than usual against NY (37.6 a game), the least of 30
Rebounds 4.5 Neutral matchup
over in 4 of 10 · avg 4.1
Low 0 · middle 3.5 · high 13
O 4.5 +115
U 4.5 -150
best O +124 FanDuel Edge -4%
Without A. Edwards4 of 11 · avg 4Both played2 of 4 · avg 3.5
Forwards get 6% fewer rebounds than usual against NY (16.9 a game), the 7th least of 30
Assists 2.5 Neutral matchup
over in 1 of 10 · avg 1.1
Low 0 · middle 0.5 · high 4
O 2.5 +600
U 2.5
Edge -6%
Without A. Edwards1 of 11 · avg 1.1Both played0 of 4 · avg 1.3
Forwards get 3% fewer assists than usual against NY (8.5 a game), the 11th least of 30
Threes 0.5 Tough matchup
over in 7 of 10 · avg 1
Low 0 · middle 1 · high 2
O 0.5 -210
U 0.5 +160
best O -185 BetMGM Edge +8%
Without A. Edwards8 of 11 · avg 1Both played3 of 4 · avg 1
Forwards get 11% fewer threes made than usual against NY (4.3 a game), the 2nd least of 30
Pts+Reb+Ast 11.5 Tough matchup
over in 6 of 10 · avg 12.3
Low 2 · middle 14 · high 20
O 11.5 -106
U 11.5 -124
best O -103 Courtside Edge +5%
Without A. Edwards6 of 11 · avg 12.2Both played1 of 4 · avg 8.8
Forwards get 10% fewer points, rebounds and assists than usual against NY (63 a game), the least of 30
Pts+Reb 10.5 Tough matchup
over in 6 of 10 · avg 11.2
Low 2 · middle 13.5 · high 18
O 10.5 -105
U 10.5 -125
best O +101 Courtside Edge +5%
Without A. Edwards6 of 11 · avg 11.1Both played1 of 4 · avg 7.5
Forwards get 11% fewer points and rebounds than usual against NY (54.5 a game), the least of 30
Pts+Ast 6.5 Tough matchup
over in 7 of 10 · avg 8.2
Low 2 · middle 8.5 · high 12
O 6.5 -133
U 6.5 +101
best O -132 Courtside Edge +12%
Without A. Edwards8 of 11 · avg 8.2Both played1 of 4 · avg 5.3
Forwards get 12% fewer points and assists than usual against NY (46.1 a game), the least of 30
Reb+Ast 5.5 Neutral matchup
over in 3 of 10 · avg 5.2
Low 0 · middle 4 · high 15
O 5.5 +107
U 5.5 -141
best O +109 Courtside Edge -14%
Without A. Edwards3 of 11 · avg 5.1Both played2 of 4 · avg 4.8
Forwards get 5% fewer rebounds and assists than usual against NY (25.4 a game), the 10th least of 30
Double-double
had one in 0 of last 10
Yes +3900
3 books
best Yes +4000 Courtside Edge -3%
Without A. Edwards0 of 11Both played0 of 4
Lines checked 2 hr ago. A typical book’s price at the line most books post; your book’s may differ.
Averages a game played
| GP | MIN | Reb+Ast | PTS | REB | AST | 3PM | STL | BLK | TO | |
|---|---|---|---|---|---|---|---|---|---|---|
| Last 10 | 10 | 20.9 | 5.2 | 7.1 | 4.1 | 1.1 | 1 | 0.4 | 0.4 | 0.5 |
| 2026–27 | 15 | 19.1 | 5 | 6.3 | 3.9 | 1.1 | 1 | 0.4 | 0.3 | 0.5 |
Season highs 2026–27 · 15 games
15Reb+Ast11/6 @ NO
12PTS11/2 vs MIL
13REB11/6 @ NO
4AST11/17 vs POR
23PM11/17 vs POR
3STL11/6 @ NO
1BLK11/17 vs POR
His games this season, from ESPN’s box scores.
Shooting made-tried a game
| GP | FG | 3PT | FT | |
|---|---|---|---|---|
| Last 5 | 5 | 2-4.247.6% | 1-2.835.7% | 1.6-2.661.5% |
| Last 10 | 10 | 2.3-546% | 1-3.330.3% | 1.5-2.365.2% |
| 2026–27 | 15 | 2.1-4.447% | 1-333.3% | 1.1-1.960.7% |
From ESPN’s box scores; the percentages are of every shot in the stretch.
Splits 2026–27, a game played
| GP | MIN | Reb+Ast | PTS | REB | AST | 3PM | STL | BLK | TO | |
|---|---|---|---|---|---|---|---|---|---|---|
| Home | 9 | 19.9 | 5.2 | 7.2 | 3.9 | 1.3 | 1.1 | 0.3 | 0.3 | 0.3 |
| Road | 6 | 18 | 4.7 | 4.8 | 3.8 | 0.8 | 0.8 | 0.5 | 0.3 | 0.7 |
| Wins | 11 | 19.6 | 6 | 6.6 | 4.8 | 1.2 | 1.1 | 0.5 | 0.3 | 0.4 |
| Losses | 4 | 17.8 | 2.3 | 5.3 | 1.3 | 1 | 0.8 | 0.3 | 0.5 | 0.8 |
| Favored | 10 | 20.8 | 6.2 | 7 | 4.8 | 1.4 | 1 | 0.6 | 0.4 | 0.4 |
| Underdog | 5 | 15.8 | 2.6 | 4.8 | 2 | 0.6 | 1 | 0 | 0.2 | 0.6 |
| Back-to-back | 3 | 20.3 | 4.3 | 5.7 | 2.7 | 1.7 | 1.3 | 0 | 0.3 | 1.3 |
Favored and underdog go by his team’s spread at the game. A split shows with 2 games or more.
Where he ranks 2026–27
6.3PTS217th
3.9REB139th
1.1ASTT-227th
47.0FG%
On the Timberwolves · 15 of 15 games played
- 7th in rebounds3.9 a game
- 7th in 3s made1 a game
- 8th in points6.3 a game
- 8th in assists1.1 a game
5% of the Timberwolves’ points in his games
5% of the Timberwolves’ shots in his games
Ranks in the NBA, from ESPN; shown for the top 500. His team’s numbers from ESPN’s box scores, players with 40% of its games.
Career a game, by season
| Season | Team | GP | MIN | PTS | REB | AST | 3PM | FG% | 3P% | FT% |
|---|---|---|---|---|---|---|---|---|---|---|
| 2026–27 | MIN | 15 | 19.1 | 6.3 | 3.9 | 1.1 | 1.0 | 47.0 | 33.3 | 60.7 |
| 2024–25 | SAC | 69 | 19.6 | 6.5 | 4.6 | 1.2 | 1.2 | 42.0 | 34.0 | 70.0 |
| 2023–24 | SAC | 58 | 20.0 | 7.2 | 4.4 | 1.2 | 1.4 | 44.5 | 38.4 | 70.0 |
| 2022–23 | SAC | 74 | 16.9 | 7.6 | 4.1 | 0.9 | 1.2 | 45.8 | 36.3 | 81.5 |
| 2021–22 | SAC | 24 | 22.8 | 10.6 | 5.6 | 1.3 | 1.0 | 48.9 | 36.5 | 85.1 |
| 2021–22 | DET | 51 | 19.4 | 10.4 | 4.8 | 1.1 | 0.9 | 45.6 | 30.1 | 78.4 |
| 2020–21 | SA | 23 | 15.6 | 5.0 | 3.7 | 0.6 | 0.6 | 47.8 | 35.0 | 65.2 |
| 2019–20 | SA | 63 | 20.2 | 6.4 | 5.7 | 1.1 | 1.0 | 44.6 | 38.7 | 73.3 |
| 2018–19 | DEN | 64 | 17.5 | 8.5 | 3.8 | 1.4 | 0.8 | 41.8 | 25.5 | 69.8 |
| 2017–18 | DEN | 73 | 19.1 | 9.9 | 4.8 | 1.2 | 1.1 | 49.1 | 38.1 | 70.6 |
| 2016–17 | UTAH | 71 | 16.3 | 6.2 | 3.3 | 1.0 | 0.9 | 36.2 | 31.9 | 72.2 |
| 2015–16 | UTAH | 80 | 17.3 | 6.1 | 3.7 | 0.7 | 0.6 | 43.8 | 38.3 | 69.5 |
| Career | 665 | 18.4 | 7.6 | 4.3 | 1.1 | 1.0 | 44.1 | 34.6 | 73.8 |
From ESPN; a season with two teams has a row for each.
Game log 15 played
| Date | Opp | Result | MIN | Reb+Ast | PTS | FG | 3PT | FT | REB | AST | STL | BLK | TO |
|---|---|---|---|---|---|---|---|---|---|---|---|---|---|
| 2026–27 | |||||||||||||
| 11/17 | vsPOR | W 106–105 | 31 | 11 | 8 | 2-5 | 2-5 | 2-4 | 7 | 4 | 0 | 1 | 1 |
| 11/16 | vsPOR | W 106–98 | 19 | 4 | 9 | 3-5 | 2-3 | 1-2 | 3 | 1 | 0 | 0 | 0 |
| 11/14 | vsCHI | L 106–117 | 19 | 3 | 5 | 1-4 | 0-3 | 3-4 | 1 | 2 | 0 | 1 | 0 |
| 11/12 | vsDAL | W 133–94 | 15 | 0 | 2 | 1-1 | 0-0 | 0-0 | 0 | 0 | 0 | 0 | 0 |
| 11/8 | vsUTAH | W 115–100 | 21 | 8 | 9 | 3-6 | 1-3 | 2-3 | 6 | 2 | 1 | 0 | 0 |
| 11/6 | @NO | W 115–109 | 29 | 15 | 5 | 2-7 | 0-4 | 1-2 | 13 | 2 | 3 | 1 | 1 |
| 11/4 | @HOU | W 117–107 | 20 | 2 | 5 | 2-3 | 1-2 | 0-0 | 2 | 0 | 0 | 1 | 0 |
| 11/2 | vsMIL | W 112–100 | 21 | 4 | 12 | 4-9 | 2-7 | 2-2 | 4 | 0 | 0 | 0 | 0 |
| 10/31 | @SA | L 111–121 | 17 | 0 | 6 | 1-3 | 1-3 | 3-4 | 0 | 0 | 0 | 0 | 3 |
| 10/30 | vsLAC | W 127–101 | 17 | 5 | 10 | 4-7 | 1-3 | 1-2 | 5 | 0 | 0 | 0 | 0 |
| 10/28 | vsGS | L 114–119 | 22 | 4 | 7 | 3-5 | 1-3 | 0-0 | 3 | 1 | 1 | 1 | 0 |
| 10/26 | @CLE | L 125–127 | 13 | 2 | 3 | 1-1 | 1-1 | 0-0 | 1 | 1 | 0 | 0 | 0 |
| 10/25 | vsTOR | W 117–94 | 14 | 8 | 3 | 1-3 | 1-3 | 0-0 | 6 | 2 | 1 | 0 | 2 |
| 10/23 | @ORL | W 115–93 | 17 | 8 | 9 | 3-6 | 2-5 | 1-3 | 6 | 2 | 0 | 0 | 0 |
| 10/21 | @MIA | W 131–106 | 12 | 1 | 1 | 0-1 | 0-0 | 1-2 | 1 | 0 | 0 | 0 | 0 |
News stories and highlights
Loading the latest on Trey Lyles…
Player stats from ESPN’s box scores; lines and prices from the books, through The Odds API. Hit rates count games played. Picks are counted across pools, My bets and Tail on The Coalition without names. Research, not betting advice. 21+.